

Pest Control Trend Analysis Auditors Accept
Third-party food safety auditors fail facilities that present raw monitoring numbers without context. Professional pest control trend analysis demands more than a monthly line chart of trap counts. Auditors test whether your site understands its own data. They expect you to weigh environmental variables. They look for documented corrective action whenever activity breaches a threshold.
Standards such as BRCGS Issue 9 and SALSA Issue 7 require verified interpretation to prove continuous site control. An auditor will ask how your team reviews device trends. Does your pest file give clear operational context, or does it simply display numbers?
Key Takeaways
- Raw counts without written interpretation count as unanalysed data and fail third-party certification audits across every major food manufacturing scheme.
- Effective trend analysis tracks pest activity over time and divides every figure by distinct risk zones inside your facility envelope.
- Auditors verify that documented action thresholds trigger formal root cause investigations rather than unrecorded visits or immediate reactive chemical treatment.
- Field biologist reviews supply technical authority, validating whether environmental change or seasonal shift drove any monitoring anomaly across reporting cycles.
- Digital pest management systems timestamp every record, which prevents rushed pre-audit reconstruction and the non-conformances that follow it.
Audit Requirements Inside a Compliant Pest File
Auditors judge whether your documentation proves genuine oversight or simple administrative tidiness. A compliant programme plots observations across time. It separates findings by factory area. It carries a written technical evaluation against every movement. That structure forces internal teams to confront root causes instead of logging trap visits without purpose.
The table below sets out the core requirements that established third-party standards demand inside a verified pest file. Check your own records against these baseline expectations. In practice, we find that this single exercise removes most of the common non-conformances raised during unannounced food hygiene inspections.
| Audit Component | Common Non-Conformance | Compliant Standard |
|---|---|---|
| Audit ComponentActivity Plotting | Common Non-ConformanceAnnual total counts without monthly context | Compliant StandardTime-series graphs plotted against set action thresholds |
| Audit ComponentZonal Mapping | Common Non-ConformanceWhole-site figures masking localised hotspots | Compliant StandardArea-specific reporting separated by operational hygiene risk |
| Audit ComponentTechnical Commentary | Common Non-ConformanceEmpty charts or missing explanatory notes | Compliant StandardWritten narrative covering causes, patterns and environmental influences |
| Audit ComponentCorrective Actions | Common Non-ConformanceRecurring recommendations left open indefinitely | Compliant StandardDocumented actions assigned to owners with close-out dates |
| Audit ComponentSpecialist Review | Common Non-ConformanceRoutine technician logs without oversight | Compliant StandardPeriodic biological reviews validating the recorded trends |
Data Presentation Over Operational Timeframes
Long-Term Activity Patterns Across Reporting Cycles
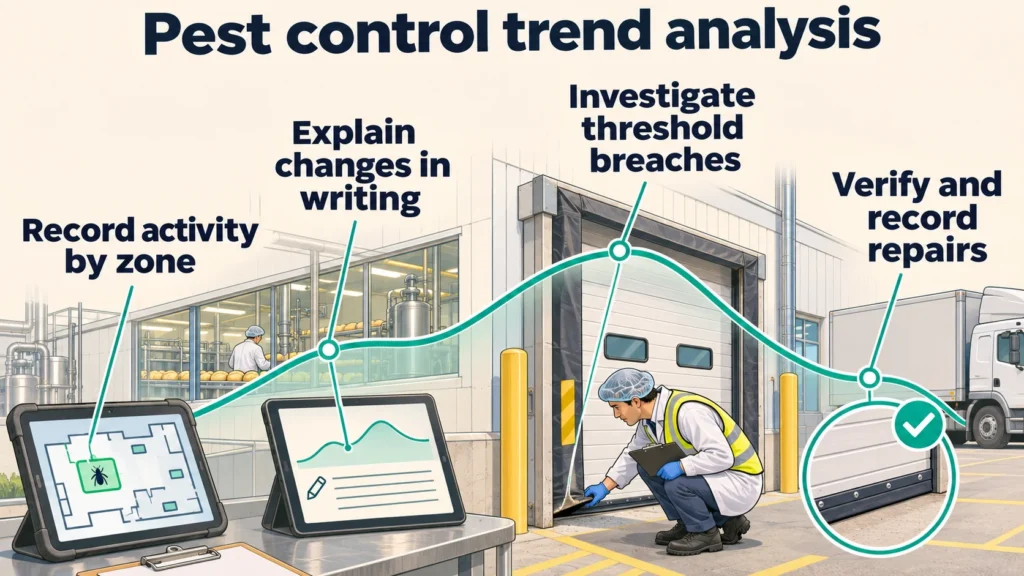
Auditors expect activity data plotted across defined intervals. Only then can anyone judge whether pest pressure is rising or falling. A rolling monthly or quarterly comparison exposes seasonal incursions. It also reveals developing harbourage. Isolated single-visit inspection sheets miss both patterns inside busy industrial production environments.
Across a multi-year timeline, technical managers must weigh baseline activity against operational variables. A summer peak in flying insect catches is an expected seasonal variance. An unexpected winter rise inside heated process rooms is not. That pattern points to a structural failure. Clear graphs let an auditor confirm that the site tracks these movements systematically.
Meaningful Monitoring Intervals and Visit Frequency
Monitoring frequency must match documented site risk rather than calendar habit. High-risk manufacturing zones often need weekly or fortnightly comparison points. Ambient dry storage warehouses can run safely on a monthly review. The aim stays constant across both: capture an emerging pest problem whilst the numbers remain small.
Irregular visit intervals distort a trend graph and hide genuine biological movement. Erratic inspections make catch counts per visit unreliable. Rate-of-capture metrics then lose all meaning. Consistent scheduling keeps the dataset defensible. An inspector can see at a glance whether your reporting genuinely shows rising activity.
Spatial Mapping Across Operational Risk Zones
Facility Division by Environmental Risk
Segregating pest data by designated hygiene zone stops a localised infestation hiding behind a site-wide average. A low total across a vast distribution centre offers no reassurance at all. The figure means nothing if every recorded rodent capture sits inside one raw ingredient store.
Auditors look for clear boundaries between low-risk warehousing and sensitive production space. Mapped monitoring points must mirror your hygiene requirements. Suppose a high-care packaging line registers crawling insect activity. Grouping those devices with external perimeter boxes destroys the practical value of the analysis.
Device Locations on the Site Plan
Every monitoring point must match an exact physical position on an authorised, dated and signed site plan. Devices that drift around the factory floor during cleaning routines create inconsistent history. That inconsistency undermines the integrity of your whole trend record during a certification review.
When a technician scans a numbered bait station, the digital record must align with the physical layout. An auditor will spot-check devices on the floor against the site map. Mismatched identifiers between floor and report invite an immediate non-conformance. From experience across the sector, this check catches more sites than any other.
Did You Know?
Food hygiene law places a statutory duty on every food business to control pests. Regulation 19(1) of the Food Safety and Hygiene (England) Regulations 2013 makes a breach an offence. On conviction on indictment, the penalty is an unlimited fine, up to two years’ imprisonment, or both.
Written Interpretation and Root Cause Analysis
Clear Explanations for Operational Deviations
A bare graph showing an activity spike gives data without analysis. It fails scheme expectations immediately. Auditors want a concise written summary. That summary must state why activity changed and which conditions triggered the event. It should also record whether the surrounding building fabric contributed during that review window.
Effective technical commentary addresses operational reality. Perhaps external groundworks disturbed the local rodent population. Perhaps prolonged machinery sanitisation left damp conditions attractive to flies. State those facts directly. Auditors accept that pest pressure fluctuates. They refuse to accept an unexplained increase that the site team never acknowledged.
Root Cause Enquiries and Documented Evidence
Knowing how to interpret pest trend analysis for auditors means proving that your facility investigates causes rather than symptoms. When captures rise, technical staff must examine drainage integrity. They must review incoming material deliveries. They must question waste handling before adding more monitoring hardware.
A documented investigation must name the primary entry points and environmental attractants. Link pest presence to a damaged loading bay seal or a defective floor gully. That link proves your team applies modern integrated pest management principles. The diagnostic trail satisfies a technical inspector that recurring pressure receives engineering control.
Free Pest Control Audit Review
We will review your risk assessment, site plan, visit reports, trend analysis, open recommendations, product records and demo our AI Pest management System.
Action Thresholds and Corrective Measures
Zone-Specific Tolerance Limits
An action threshold states the exact catch volume that triggers a formal investigation within a named area. Those limits must vary sensibly between zones. A single mouse inside a sterile mixing vessel is an emergency. An occasional capture on the external perimeter is normal buffer operation.
Schemes expect a site to justify who set each threshold and explain the scientific basis behind the figure. Thresholds set absurdly high to avoid breach reporting attract heavy scrutiny. Realistic, defensible trigger points show that your quality management system actively monitors contamination risk. Arbitrary numbers show the opposite.
Recommendations Tracked to Documented Resolution
A recorded threshold breach demands an immediate corrective action with clear ownership and a target date. Noting that a shutter door needs replacement is not enough. Auditors verify who took the repair. They then demand documented physical evidence that the work actually reached completion.
Recommendations left open across consecutive technician visits remain one of the most common non-conformances in commercial facilities. Inspectors review historic reports closely. Identical proofing advisories repeated month after month tell a clear story. The site then carries a penalty for operating an unmanaged risk mitigation process.
AI Pest Management
AI pest management is pest control delivered with continuous digital monitoring and analytics rather than paper records, with real time data access across a single or multiple sites.
Scheme Expectations Across Food Standards
BRCGS Issue 9 Requirements for Trend Records
The BRCGS Global Standard Food Safety Issue 9 sets detailed expectations for monitoring records and analytical reporting within section four. A certified facility must produce structured trend analysis supported by formal review. That review proves its preventative measures stayed effective throughout the annual operational cycle.
Sites need structured documentation that demonstrates traceability across every device inspection. Auditors check that raw inspection data feeds directly into a structured review. The chain must stay unbroken from scan to conclusion. External pest challenge then never compromises product safety or breaches a customer supplier code.
SALSA Rules for Small Food Producers
Small and micro food businesses certified under SALSA Issue 7 face stringent scrutiny over documentation completeness. Smaller administrative teams earn no concession. The standard calls for documented contracts, signed bait plans and regular servicing notes. It also expects an annual trend evaluation covering every processing environment.
Every SALSA audit from 1 September 2026 runs against Issue 7, with no transition period. Small manufacturers still struggle because administrative requirements do not scale down with headcount. A simple list of completed visits will prompt a non-conformance. Structured, templated analytical reporting bridges that resource gap.
Independent Biological Surveys and Oversight
Field Biologist Validation of Trend Data
Major certification standards require a periodic site survey from an independent field biologist or equivalent technical expert. These detailed inspections deliver external verification. They confirm that day-to-day servicing technicians have not overlooked a proofing defect, subtle activity or a flawed data plotting routine.
A qualified biologist examines historical catch figures with scientific detachment. The review correlates recorded captures against deep-seated operational practice. Formal reports then carry extensive written commentary that reinforces your internal evaluation. Auditors lean heavily on these specialist appraisals when judging whether the facility holds genuine site control.
In-House Pest Sightings Logs Under Audit
An internal staff sightings log is an essential trend data source, and auditors scrutinise it closely during a facility walk-through. The register shows whether operational staff report pests between formal servicing dates. Those entries give the management team genuine early warning of a developing problem.
Auditors treat a spotless twelve-month log with deep scepticism rather than approval. A blank sheet usually signals a failed reporting channel or untrained staff. Occasional sightings are statistically normal in a busy facility. Every logged sighting must show a contractor investigation, a recorded root cause and a documented resolution.
Digital Systems Versus Manual Records
Gaps Created by Manual Record-Keeping
Paper folders filled with handwritten technician dockets lose pages, hide illegible notes and break the action trail. Trend analysis assembled on a spreadsheet days before an audit usually carries transcription errors. Those errors undermine the credibility of your entire compliance portfolio in front of an inspector.
Modern commercial operations rely on dedicated digital reporting for continuous compliance records. Automated systems capture device scans on site and generate an instant electronic timestamp. That verified chronological chain assures an auditor of systematic collection. Nobody can reconstruct the record retroactively the week before an inspection.
Dynamic Spatial Reporting and Heat Maps
Digital pest platforms let a technical manager view automated heat maps and instant trend charts. Filters segment the picture by device type, department and date range. The system surfaces subtle recurring activity clusters. Teams then act on an emerging threat before the numbers breach any regulatory threshold.
Granting an auditor secure read-only digital access turns verification into a smooth operational check. Inspectors interrogate raw data themselves. They examine photographic evidence of closed actions. They evaluate trend patterns independently. That transparency confirms firm control over internal hygiene and building integrity.
Final Thoughts
Compliance in modern food manufacturing requires technical managers to treat pest control trend analysis as an active diagnostic system. It is not an administrative chore. Recording catches without operational context guarantees a non-conformance under current standards. Auditors judge how thoroughly your business interrogates its own records. They examine local proofing and underlying environmental factors. A trend report must tell a complete operational story against defined tolerances.
Moving from fragmented handwritten records to digital reporting keeps monitoring data accessible, verifiable and permanently audit-ready. Documented thresholds, robust biological review and clear zoning prevent an unexpected infestation. Link biological observation directly to engineering works orders and your compliance folder becomes an unassailable record of proactive control. Review your monitoring records against certification criteria before the next unannounced audit arrives.
Request a Free Site Survey
Frequently Asked Questions
A:
Pest control trend analysis plots pest activity over time and across specific site locations. It shows whether environmental pressure is rising, stable or falling. A chart of trap catch counts remains raw data. Certification auditors require written commentary alongside it. That commentary explains why the pattern shifted and which operational or external factors drove the movement. It records the corrective action taken on site. It also confirms whether that intervention resolved the underlying problem.
A:
Audit standards require the food business to demonstrate full operational ownership of its pest control system. The analysis itself can come from your professional pest contractor or your internal technical team. Either route satisfies the standard. What matters is that the report exists and carries written interpretation rather than raw figures alone. Responsible site personnel must understand the conclusions. They need to explain those conclusions confidently during the audit inspection.
A:
An action threshold is a predetermined level of recorded activity that triggers a formal investigation. Thresholds are never zero. They differ significantly by hygiene zone and by species. Crossing an agreed threshold must prompt a root cause investigation, a proofing repair or a cleaning review. An unrecorded chemical treatment is not an acceptable response. Auditors inspect records to verify who established each threshold. They then confirm that every breach closed out properly.
A:
An internal sightings log that stays empty across several audit cycles draws heavy suspicion from scheme inspectors. Occasional insect or wildlife sightings are statistically normal in a busy manufacturing or warehousing facility. A pristine log usually points to one of three failures. Staff were never trained to recognise signs of activity. The reporting system is inconvenient to use. Or a blame culture stops people recording what they see.
A:
A routine trend report plots technician inspection readings across time and zones to highlight ongoing operational patterns, and a field biologist survey is an independent technical review carried out by an advanced pest specialist. The biologist inspects the whole building fabric. They review the validity of the ongoing programme, audit the recorded trend data itself and they also identify hidden contamination risks that a routine servicing visit might overlook.



By choosing Shield Pest Management, you’re partnering with a company that combines local expertise with industry-leading practices. Our commitment to quality, compliance, and customer satisfaction makes us an ideal choice for both residential and commercial pest control needs.
